bcobb
Statecharts: A Visual Formalism For Complex Systems
Dec 8, 2014
Last week’s Hacker School Paper of the Week, Notation as a tool of thought (Iverson), stated that good notation has (at least) the following characteristics:
- Ease of expressing constructs arising in problems.
- Suggestivity.
- Ability to subordinate detail.
- Economy.
- Amenability to formal proofs.
This week’s paper, Statecharts: A Visual Formalism For Complex Systems (Harel), details a notation for specifying complex systems. By Iverson’s characteristics (which he notes are not exhaustive, but certainly necessary), it is (almost1) a good notation. Unlike the notation in Iverson’s paper, Harel’s notation is predominately visual2. Here is a cropping of the Statechart that describes the author’s digital wristwatch:
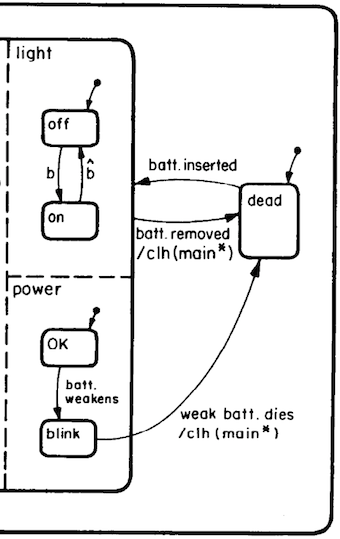
The arrows whose tails are dots denote the entry point of that subchart.
In this case, the watch is initially dead; when the battery is inserted, the light is initially off; the power indicator is initially OK.
Arrows, on the other hand, represent transitions, with the label alongside the arrow serving to document the event causing the transition.
In this diagram, b indicates that the b button was pressed, so we know that pressing b transitions the light from off to on.
When the battery weakens, the power indicator begins to blink.
Dashed lines denote concurrent subcharts, so we know that when the battery weakens, the power indicator will start to blink no matter what else is happening on the watch. Perhaps it will do so while the wearer is pressing b. It will definitely do so while something else is happening on the watch, even if that something is merely ticking the time away.
The solid outline at the tip of the batt. inserted event indicates a subchart boundary, so everything inside the left-hand solid boundary depends on the battery having been inserted.
This means that, if we were for some reason interested only in how the presence or absence of a live battery affected the watch, we could remove all of the subcharts on the left-hand side and have a more succinct but no less informative or correct picture.
One can imagine a tool to manipulate state charts would allow its operator to collapse and expand subcharts to hide or show detail as needed.
And by no means is the above diagram an exhaustive example of a Statechart’s expressiveness; there are affordances available to represent more nuanced behaviors, and Harel presents several ideas in the paper for future enhancements. But with just a few boxes, arrows, and labels, we have a clear picture of system dependencies, concurrent operations, initial states, and possible actions for a realistic example.
To me, the most exciting aspect of Statecharts is their potential to be not just a description of a system, but the primary description of the system. From the Conclusion:
It is quite fair to say that most existing visual description methods in computer science are predominately intended as aids…Here we are suggesting that visual formalism should be the name of the game; one uses Statecharts as the formal description itself, with each graphical construct given a precise meaning…Textual representations of these visual objects can be given, but they are the aids…and not the other way around.
I agree with Harel that visual formalism should be the name of the game, but a cursory scan of the state chart implementations on GitHub seems to indicate that it has not yet become the name of the game. Still, there’s some exciting work on interfaces which permit direct manipulation by folks like Bret Victor and Toby Schachman—Shadershop being a recent example—and I hope that more programmers put their expertise towards these efforts in the future. For folks interested in doing so, I think Harel’s paper is a great place to start.
-
To my eyes, it’s missing an obvious amenability to formal proofs. On gut feel alone, it feels like one could use some Statecharts in the process of proof. But the author doesn’t come out and say that any Statechart lends itself to proofs, so I won’t either. ↩
-
Though as far as I can tell it is not particularly spatial. That is, it paints a picture, but the picture seems to be primarily one of boundaries and arrows; there don’t appear to be any sort of “diagram physics” at play. ↩